GLP-1 Weight Loss by State: Obesity Rates & Medicaid Coverage
Adult obesity affects 33.1% of US adults as of 2024 (CDC Nutrition, Physical Activity, and Obesity - BRFSS), but the rate, and the help available to treat it, varies widely by state. The tables below show adult obesity prevalence for every state and DC, alongside whether each state’s Medicaid program covers GLP-1 medications for weight loss. Select your state for the full picture and what to compare when choosing a provider.
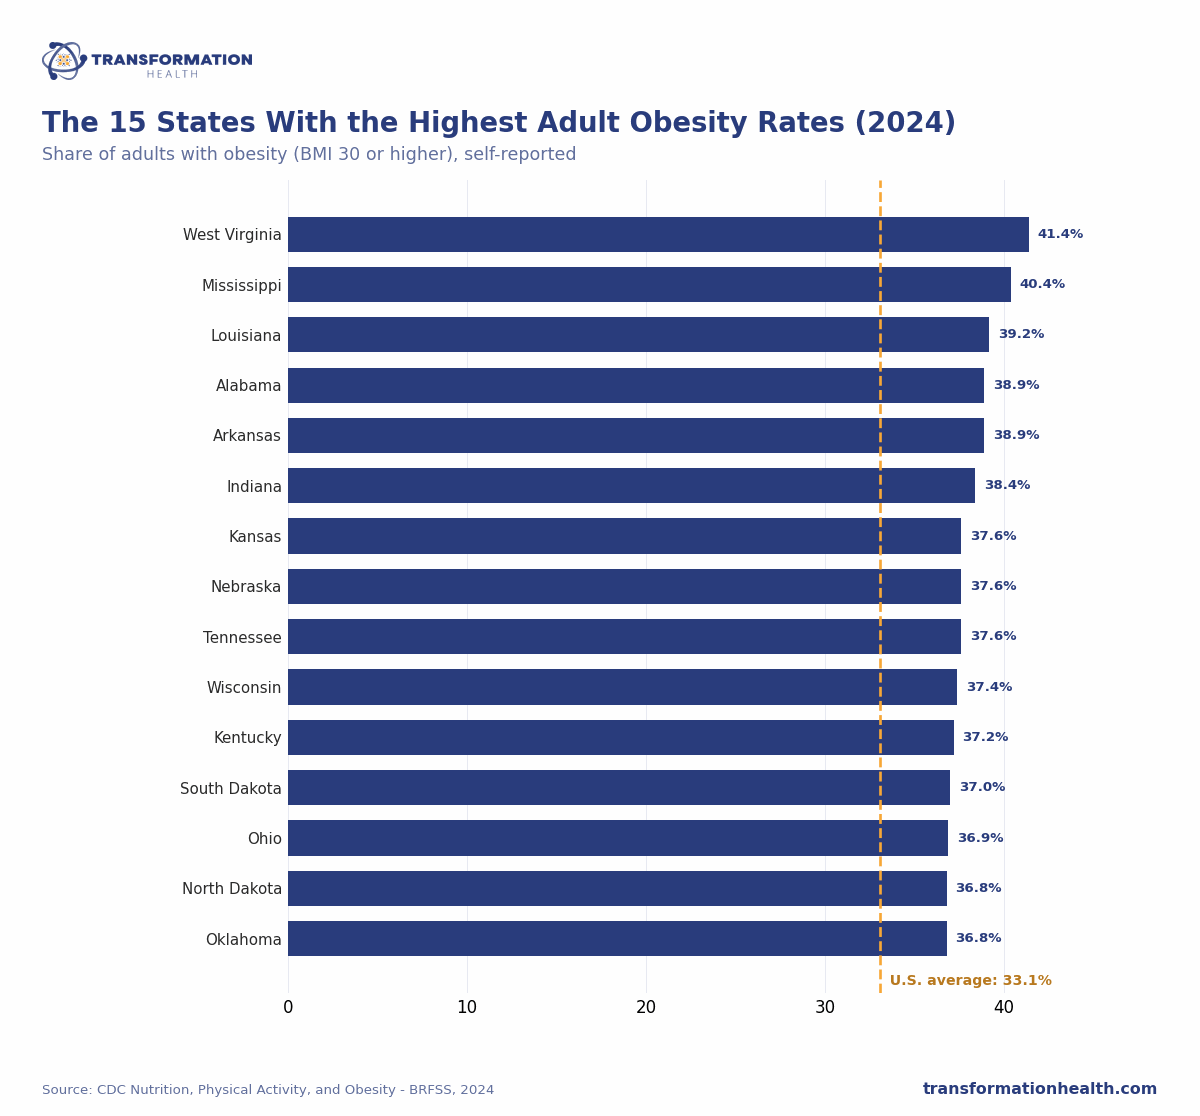
Embed this chart on your site (free)
Copy this code. It credits Transformation Health with a link back to this page.
A note on Medicaid: As of October 2026, our review of the 51 Medicaid programs (50 states and DC) found 8 that cover at least one GLP-1 medication for weight management, usually with prior authorization, 3 that cover them only under narrow conditions, and 8 that ended that coverage in 2025 or 2026. Coverage for type 2 diabetes is more common and is separate from weight-management coverage. Where covered, prior authorization is almost always required. Where a state does not cover these medications for weight loss, most people pay cash, through an in-person provider or a telehealth program whose providers are licensed in their state.
Adult obesity and GLP-1 Medicaid coverage by state
| State | Adult obesity | Rank | Medicaid (weight loss) |
|---|---|---|---|
| West Virginia | 41.4% | 1 | Generally not covered |
| Mississippi | 40.4% | 2 | Covered (with PA) |
| Louisiana | 39.2% | 3 | Generally not covered |
| Arkansas | 38.9% | 4 | Generally not covered |
| Alabama | 38.9% | 5 | Generally not covered |
| Indiana | 38.4% | 6 | Generally not covered |
| Nebraska | 37.6% | 7 | Generally not covered |
| Kansas | 37.6% | 8 | Covered (with PA) |
| Tennessee | 37.6% | 9 | Covered (with PA) |
| Wisconsin | 37.4% | 10 | Covered (with PA) |
| Kentucky | 37.2% | 11 | Generally not covered |
| South Dakota | 37.0% | 12 | Generally not covered |
| Ohio | 36.9% | 13 | Generally not covered |
| Oklahoma | 36.8% | 14 | Generally not covered |
| North Dakota | 36.8% | 15 | Generally not covered |
| Iowa | 36.6% | 16 | Generally not covered |
| Delaware | 36.6% | 17 | Covered (with PA) |
| Michigan | 36.1% | 18 | Restricted |
| Texas | 35.6% | 19 | Generally not covered |
| Georgia | 35.4% | 20 | Restricted |
| South Carolina | 34.6% | 21 | Recently ended |
| Missouri | 34.6% | 22 | Covered (with PA) |
| North Carolina | 34.5% | 23 | Covered (with PA) |
| New Mexico | 34.5% | 24 | Generally not covered |
| Pennsylvania | 34.2% | 25 | Recently ended |
| Nevada | 34.2% | 26 | Generally not covered |
| Illinois | 34.2% | 27 | Generally not covered |
| Alaska | 34.0% | 28 | Generally not covered |
| Oregon | 33.5% | 29 | Generally not covered |
| Arizona | 33.3% | 30 | Generally not covered |
| Maine | 33.2% | 31 | Generally not covered |
| Maryland | 32.7% | 32 | Generally not covered |
| Idaho | 32.7% | 33 | Generally not covered |
| Wyoming | 32.5% | 34 | Generally not covered |
| Virginia | 32.3% | 35 | Restricted |
| Minnesota | 32.3% | 36 | Covered (with PA) |
| Connecticut | 32.0% | 37 | Recently ended |
| Washington | 31.5% | 38 | Generally not covered |
| Rhode Island | 31.1% | 39 | Recently ended |
| New Hampshire | 31.1% | 40 | Recently ended |
| Utah | 31.0% | 41 | Recently ended |
| Montana | 31.0% | 42 | Generally not covered |
| Florida | 29.6% | 43 | Generally not covered |
| New York | 29.5% | 44 | Generally not covered |
| California | 29.1% | 45 | Recently ended |
| Vermont | 29.0% | 46 | Generally not covered |
| New Jersey | 27.7% | 47 | Generally not covered |
| Massachusetts | 27.0% | 48 | Recently ended |
| Hawaii | 27.0% | 49 | Generally not covered |
| District of Columbia | 25.5% | 50 | Generally not covered |
| Colorado | 25.0% | 51 | Generally not covered |
Rank 1 = highest obesity prevalence. Full sources and methodology are listed below.
We're relaunching soon
We're relaunching as an independent GLP-1 guide. Leave your email and we'll let you know when your free custom report is ready.
Get StartedData sources and methodology
- Adult obesity: CDC Nutrition, Physical Activity, and Obesity, Behavioral Risk Factor Surveillance System. Prevalence is the percentage of adults with a body mass index of 30 or higher, based on self-reported height and weight, so figures may differ from measured surveys such as NHANES. National rate: 33.1% (2024).
- Medicaid coverage: Transformation Health review of each state’s Medicaid preferred drug list, prior-authorization criteria, and provider notices, as of October 2026. Each state page links the state document used. Coverage changes frequently. Status shown here is for general information; confirm current benefits with your state Medicaid program.
- Data current as of: 2024 CDC release. Page last updated: October 17, 2026.
Important: Compounded medications are not FDA-approved products. They are prepared by US-based, state-licensed compounding pharmacies and have not been independently evaluated by the FDA for safety, efficacy, or quality. Medicaid coverage information is general and changes frequently; confirm with your state program. A licensed provider decides whether a prescription is appropriate. Results vary by individual. Transformation Health is an independent guide. It does not provide medical care, prescribe, or sell medication.